Google Analytics 4: Setup and Configuration From Scratch (2026 Guide)
GA4 is the only mass-market web analytics platform left after the death of Universal Analytics. We walk the full path: property and data stream, tag installation, key events, GSC and Google Ads links, Consent Mode v2, and traffic from ChatGPT.
Without analytics, any marketing turns into guesswork.
You can pour money into SEO, ads, and content, but if you can’t see where people come from and what they do on your site, you are not in control of the outcome. Google Analytics 4 is the free standard of web analytics, and in 2026 it has practically no mass-market alternatives.
In this guide we’ll walk the entire path: from creating an account to setting up conversions, linking Search Console and Google Ads, and tracking traffic from ChatGPT. No theory for theory’s sake — only what you actually need to do hands-on.
In short: how do you install Google Analytics 4? Create an account at analytics.google.com, add a GA4 property and a web data stream — you’ll get an ID that looks like G-XXXXXXX. Then install the tag on your site in one of three ways: the gtag.js snippet in the head section, Google Tag Manager, or your CMS plugin. Verify data collection in the Realtime report — data shows up within a few minutes.
What GA4 is and why it’s your only option
Google Analytics 4 (GA4) is Google’s web analytics platform that collects data about website and app visitors in the form of events. Every user action — a pageview, a click, a scroll, a form submission, a purchase — is recorded as a separate event with a set of parameters.
Google shut down the previous generation, Universal Analytics, for good in 2023, so you can safely close every old guide about “the UA-XXXXX tracking code.” If you see a tutorial that mentions “views” and an ID starting with “UA-”, it’s obsolete.
How GA4 fundamentally differs from the old analytics:
- An event model instead of a session model. The session and pageviews used to be the center of everything; now it’s the user and their events. This lets you stitch behavior across a website and a mobile app within a single property.
- Key events instead of goals. The familiar “goals” are gone: you mark important events as key events with a single toggle.
- Machine learning and modeling. When some users decline cookie consent, GA4 fills in the picture with behavioral modeling.
- Free BigQuery export. Raw data export used to be a privilege of the paid version; now it’s available to everyone.
- Privacy by default. GA4 doesn’t store users’ IP addresses and is designed to work with Consent Mode — critical for EU traffic.
The GA4 interface feels empty at first compared to the old analytics: there are fewer standard reports. That’s intentional — the basic reports give you an overview, and everything deeper is built in the Explorations section, tailored to your tasks.
GA4 keeps evolving fast. In December 2025 Google rolled out Analytics Advisor — a built-in AI assistant you can ask questions about your data in plain language — and since 2026 it has been testing cross-channel budgeting right inside Analytics. So GA4 skills are a long-term investment.
Step 1. Create the account, property, and data stream
The GA4 structure has three levels, and it’s important to understand them before you start:
- Account — the top level, usually one per company. A single account can hold up to 2,000 properties.
- Property — corresponds to a business or product. All data and reports live at the property level.
- Data stream — a specific data source: a website, an iOS app, or an Android app. One property can have several streams.
A typical mistake is creating a separate property for every subdomain or for the mobile version of a site. Don’t: one business — one property, with streams living inside it.
Now step by step:
- Go to analytics.google.com with your Google account and click “Start measuring.”
- Enter the account name (usually your company name) and configure the data-sharing settings.
- Create a property: a name (for example, “SEOquick — website”), the reporting time zone, and the currency. Pick the time zone of your core audience — it determines how sessions are split across days.
- Fill in the business information: industry, company size, how you plan to use GA4. The goals you select determine the set of standard reports GA4 shows by default.
- Accept the terms of service and create a web data stream: enter the site URL and a stream name.
After the stream is created, you’ll get a Measurement ID that looks like G-XXXXXXXXXX. That’s your “tracking code number” in GA4 terms — you’ll need it for installation.
Right away, without leaving the stream settings, do three things:
- Check that Enhanced Measurement is on. It automatically tracks 90% scrolls, outbound link clicks, site search, YouTube video views, and file downloads — without a single line of code.
- In the data collection settings, enable Google Signals if you plan to run remarketing.
- Go to “Data settings → Data retention” and change the retention period from 2 months to 14 months. The default is the minimum, and a couple of months later you’ll be surprised to find Explorations has no data for the previous quarter.

Step 2. Install the tag on your site
There are three working ways to put GA4 on a site. The choice depends on who you are: a developer, a marketer, or a site owner on a CMS.
Method 1: directly via gtag.js
The simplest option for static sites and custom-built projects. In the data stream settings, open “View tag instructions” → “Install manually” and copy the code snippet:
<!-- Google tag (gtag.js) -->
<script async src="https://www.googletagmanager.com/gtag/js?id=G-XXXXXXXXXX"></script>
<script>
  window.dataLayer = window.dataLayer || [];
  function gtag(){dataLayer.push(arguments);}
  gtag('js', new Date());
  gtag('config', 'G-XXXXXXXXXX');
</script>
Paste it into the <head> section on every page of the site, as close to the opening tag as possible. If the code sits only on the homepage, you’ll see just a fraction of your traffic, and referral sources will be distorted.
The upside of this method — nothing extra. The downside — every custom event (form submission, button click) will require hand-written JavaScript.
Method 2: via Google Tag Manager (recommended)
Google Tag Manager (GTM) is a free tag management system that lets you control all of your site’s trackers and pixels from a single interface, with no code edits. For any serious project it’s the standard: you install the GTM container once, and from then on the marketer adds GA4, Google Ads, Meta Pixel, and any other tags on their own.
The procedure:
- Create a container at tagmanager.google.com and install the two GTM code snippets on the site (in
<head>and right after the opening<body>). - In GTM, create a tag of the “Google Tag” type and enter your Measurement ID
G-XXXXXXXXXX. - Trigger — “Initialization — All Pages.”
- Click “Preview,” open the site in debug mode, and make sure the tag fires.
- Publish the container.
Important: don’t double-install. If GA4 is set up both via gtag.js and via GTM, every pageview will be counted twice — one of the most common mistakes we find in audits.
Let’s show GTM’s power on a typical task — tracking clicks on a phone number:
- In GTM, enable the built-in click variables (“Variables → Configure → Click URL”).
- Create a “Click — Just Links” trigger with the condition: Click URL contains
tel:. - Create a “Google Analytics: GA4 Event” tag, event name —
click_phone, and add alink_urlparameter with the Click URL variable as its value. - Test in preview mode: click the phone number on the site and confirm the tag fired.
- Publish the container, wait for the event to appear in GA4, and mark it as a key event.
Not a single edit to the site’s code — and that’s how you set up practically any interaction: form submissions, messenger button clicks, scroll depth, calculator interactions.
Subdomains and single-page applications
Two technical cases people regularly trip over:
- Subdomains (site.com and blog.site.com) — nothing to configure: GA4 tracks them in a single stream automatically, and the cookie is set on the root domain. The key thing is the same Measurement ID everywhere.
- Different domains (site.com and checkout-site.net) — you need cross-domain tracking: “Data streams → Configure tag settings → Configure your domains.” List all the domains there; otherwise moving between them will break the session, and conversions will be attributed to the wrong source.
- SPAs on React/Vue — virtual pageviews. Enhanced Measurement has a “Page changes based on browser history events” option that covers most cases, but verify correctness in DebugView: the page_view event sometimes fires twice on the first load.
Method 3: CMS plugins and built-in integrations
If your site runs on a popular CMS, you may not need to touch the code at all:
- WordPress — the official Site Kit by Google plugin: sign in, pick your GA4 property, and the tag is installed automatically. Alternatives — GA Google Analytics, MonsterInsights.
- Shopify — native integration: connect Google & YouTube in your store settings and select the GA4 property. E-commerce events (view item, add to cart, purchase) are passed out of the box.
- Wix, Squarespace, Tilda — a “Google Analytics ID” field in the site settings where you paste
G-XXXXXXXXXX. - OpenCart, PrestaShop, Joomla — modules from the official marketplaces, or pasting gtag.js into the template.
Whichever method you use, open the Realtime report afterwards and visit the site from your phone or an incognito window. If you see yourself in the report — it works. For a deeper check, use the Google Tag Assistant extension or DebugView inside GA4 (“Admin → DebugView”).
Step 3. Key events instead of goals: setting up conversions
Here’s the main terminology change of recent years. In March 2024 Google officially renamed GA4 conversions to key events — to separate the concept from Google Ads conversions, where the word has an advertising meaning.
The logic now works like this:
- Event — any user action that GA4 records.
- Key event — an event you’ve marked as important for the business (a lead, a call, a purchase). Up to 30 key events per property.
- Conversion — the term survives only in the Google Ads context: it’s a key event imported into the ad account for bid optimization.
How to create a key event
Scenario 1 — the event is already being collected automatically. Say you want to count price-list downloads as conversions: the file_download event already exists thanks to Enhanced Measurement. Go to “Admin → Events,” find it, and flip the “Mark as key event” toggle. Done.
Scenario 2 — you need a condition-based event. The classic is a visit to the “Thank you for your request” page:
- Open “Admin → Events → Create event.”
- Name the event, for example
generate_lead_thankyou. - Condition:
event_nameequalspage_viewANDpage_locationcontains/thank-you. - Save, wait for the first trigger, and mark the new event as key in the same section.
Scenario 3 — custom events via GTM. A form submitted without a page reload, a click on a phone number, a click on a messenger button — all of this is configured with Tag Manager triggers and a “Google Analytics: GA4 Event” tag. It’s the most flexible path, and it’s the one used most often in real projects.
A few rules earned through practice:
- Don’t mark
page_vieworsession_startas key events — a conversion should reflect a business outcome, not the fact of a visit. - Name events following Google’s conventions (
generate_lead,purchase,sign_up) — then the recommended reports and Google Ads will pick them up correctly. - For an online store, set up e-commerce without fail: the
view_item,add_to_cart,begin_checkout, andpurchaseevents withvalueandcurrency. Without conversion value you can’t calculate ROAS.
Event parameters and custom dimensions
Every GA4 event has parameters — extra data about the action. For file_download it’s the file name, for purchase it’s the order amount and contents, for your form it might be the request type or the selected service.
An important nuance that isn’t obvious to beginners: custom parameters don’t show up in reports on their own. To see them in tables and Explorations, you must register each parameter as a custom dimension: “Admin → Custom definitions → Create custom dimension,” specify the parameter name and the scope (event or user). A standard property allows up to 50 event-scoped dimensions.
Register the dimension before or right after launching the event: data from the period when the parameter wasn’t registered will never appear in reports for that dimension.
SEOquick’s experience. Key events aren’t just about ads — they’re also how you judge the quality of SEO traffic. On a financial website project, we built programmatic generation of over 50,000 landing pages for long-tail queries and monitored quality through GA4: organic delivered an 82% engaged-session rate, and traffic grew 11x — from 130 to 1,480 users per day. Details in our binary options website case study (in Russian).
Step 4. Making sense of the reports
The GA4 interface consists of four main sections: Home, Reports, Explorations, and Advertising. Let’s walk through the ones you’ll need every day.

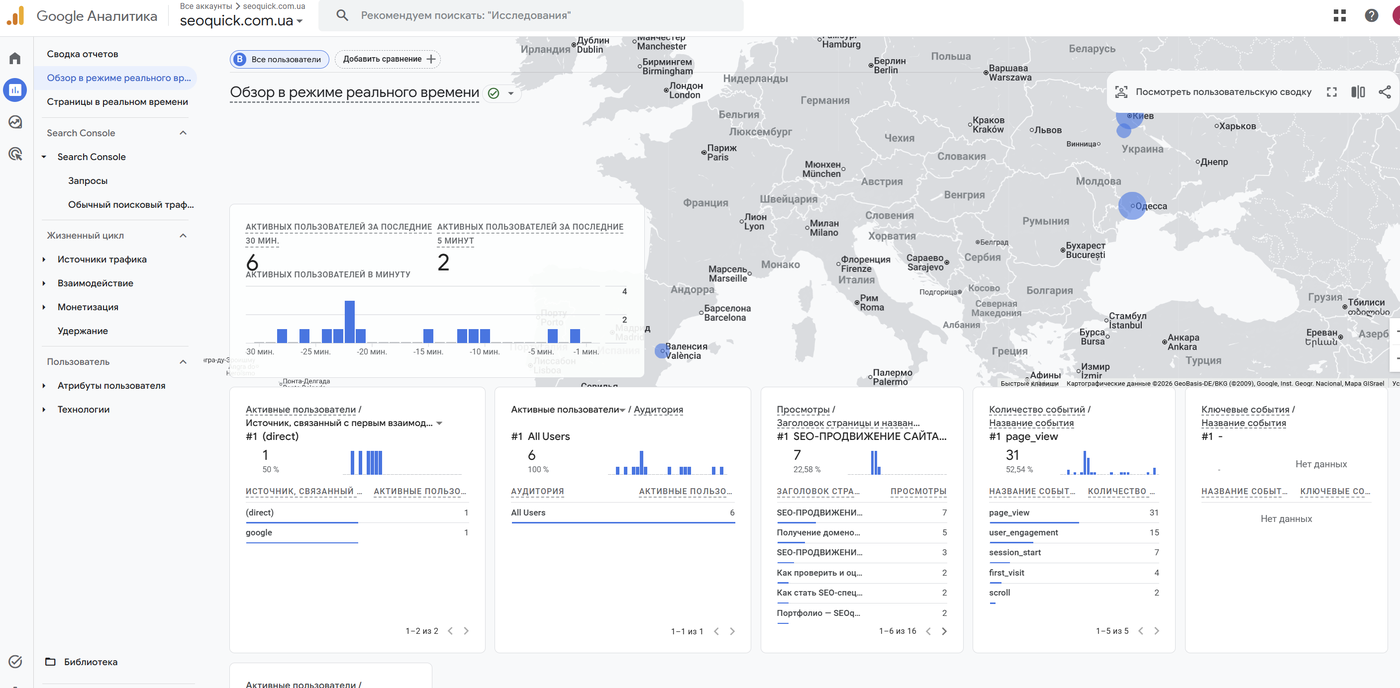
Realtime
Shows activity for the last 30 minutes: who is on the site right now, from which sources, on which pages, which events are firing. Its main use is verifying your setup: you launched a campaign, added a new event, published a landing page — you instantly see whether data is flowing.
Acquisition
Two key reports: “User acquisition” (the channel a user arrived through for the first time) and “Traffic acquisition” (channels by session). Here you see the breakdown: Organic Search, Paid Search, Direct, Referral, Organic Social, Email, and so on.
Pay attention to the “Session source/medium” dimension — it’s the most granular view: google / organic, chatgpt.com / referral, newsletter / email. To evaluate SEO, look at Organic Search trends by week and month, not by day — daily fluctuations are noisy.
Engagement
This is where the reports on events, key events, pages, and screens live. Instead of bounce rate, GA4’s core metric is engagement: a session counts as engaged if it lasted longer than 10 seconds, contained a key event, or included at least two pageviews.
The “Pages and screens” report is the workhorse of content analysis: which pages attract traffic, how much time people spend on them, which events they generate. It’s exactly where we look when deciding which blog articles to update first.
User and Tech
The User section shows the audience’s geography, language, gender, and age (demographics are available when Google Signals is enabled); Tech shows devices, browsers, and screen resolutions.
The practical value isn’t “interesting to look at” — it’s decisions. Mobile traffic share grew to 70% while mobile conversion is half of desktop? That’s an argument for a mobile UX audit. A sizable audience from a country you have no language version for? A reason to consider creating one.
Advertising and attribution
The Advertising section answers the question that torments every marketer: which channel actually drove the conversion if the user first came from organic, then returned from a newsletter, and finally bought via a direct visit.
The “Conversion paths” report shows the chains of touchpoints, and “Model comparison” shows how channel value shifts under different models. By default GA4 uses data-driven attribution: machine learning distributes conversion credit across touchpoints based on each one’s real contribution.
Explorations
Explorations is a builder for custom reports inside GA4: you choose the dimensions, metrics, segments, and visualization yourself. Standard reports give you an overview; explorations give you answers to specific questions.
The most useful templates:
- Free form — a pivot table: for example, source × landing page × key events.
- Funnel exploration — the path to conversion step by step, with the drop-off rate at each step. Since 2025 GA4 supports both open and closed funnels — you can analyze strict sequences as well as flexible entry scenarios.
- Path exploration — where people go after the homepage, where they loop.
- Cohort exploration — user retention by week after the first visit.
Good news for anyone running several projects: since March 2025 Google lets you copy reports and explorations between properties — no more rebuilding the same dashboards for every client by hand.
When standard reports aren’t enough: Looker Studio
For client reports and summary dashboards, use Looker Studio (formerly Data Studio) — Google’s free visualization tool with a native GA4 connector. Connecting takes a couple of minutes: “Create → Data source → Google Analytics → pick the property.”
One caveat: the connector works through the Google Analytics Data API, which has request quotas. If the dashboard is large and many people view it, data may temporarily stop refreshing with a quota-exceeded error. The cure is simplifying the dashboard, using Extract Data, or exporting to BigQuery.
Speaking of BigQuery. The free native export of raw GA4 data to Google’s cloud warehouse (“Admin → Product links → BigQuery”) is insurance for the future. In the GA4 interface, data is aggregated and limited by the retention period, while BigQuery stores every event of every user without sampling and without an expiration date. Even if you have nothing to process SQL tables with right now, turn the export on: data will start accumulating, and when you need deep analytics or AI processing, the history will already be there.
Step 5. Link GA4 to Search Console and Google Ads
GA4 only unlocks its full potential when linked with other Google tools. Two mandatory integrations:
Search Console
The link adds two reports to GA4: “Queries” (which search phrases your site appears and gets clicked for in Google) and “Google organic search traffic” (landing pages with impressions, clicks, and position data).
How to link:
- In GA4: “Admin → Product links → Search Console links.”
- Click “Link,” choose the verified Search Console property (you need owner permissions) and the web stream.
- After linking, make the reports visible: “Reports → Library → Search Console collection → Publish.” Almost everyone skips this step, and without it the reports don’t appear in the menu.
Google Ads
Without this link, your advertising flies blind. The integration gives you three things: importing GA4 key events as conversions for bid optimization, remarketing audiences from GA4, and end-to-end campaign data in your analytics reports.
Setup: “Admin → Product links → Google Ads links” → choose the account → enable personalized advertising. Then in Google Ads itself: “Goals → Conversions → New → Import → Google Analytics 4 properties.”
It’s also worth mastering GA4 audiences — user segments built on any set of conditions that are automatically passed to the linked Google Ads account for remarketing. A few working examples:
- “Added to cart but didn’t buy within 7 days” — the classic win-back segment;
- “Read 3+ blog articles” — a warm audience for promoting services;
- “Visitors of a specific category’s pages” — for segmented campaigns;
- the predictive audience “Likely 7-day purchasers” — GA4 builds it with machine learning once enough purchase events have accumulated.
Audiences are created in “Admin → Audiences” and only start filling from the moment of creation, so set up your basic segments right after installation — by the time you launch ads, they’ll already be populated.
Among the new features: Google is gradually bringing third-party advertising data into GA4 too — in late 2025 native cost import from Meta, TikTok, Pinterest, and Reddit appeared, so you can compare channel performance without leaving Analytics.
Consent Mode v2: mandatory if you have EU traffic
If users from the European Economic Area or the UK visit your site, this section is not optional.
Consent Mode v2 is Google’s mechanism that passes the user’s data-processing consent status to GA4 and Google Ads and adapts how the tags behave accordingly. Since March 2024 it has been mandatory for everyone using Google’s advertising features in the EEA, and since July 2025 Google has been forcibly disabling remarketing and conversion tracking for accounts without it.
What you need to do:
- Install a consent banner (CMP). Use a platform from Google’s certified list: Cookiebot, CookieYes, Usercentrics, Iubenda, and others. A home-made “we use cookies, OK” banner doesn’t count.
- Pass four consent signals:
analytics_storage,ad_storage, and the two new v2 parameters —ad_user_data(consent to use data in advertising) andad_personalization(consent to personalization and remarketing). - Choose a mode. Basic — tags don’t fire until consent is given, and data on users who declined is lost entirely. Advanced — tags send anonymized, cookieless signals, and GA4 models the missing conversions with behavioral modeling. For analytics, Advanced is noticeably more useful.
- Check the status in GA4: “Admin → Consent settings” — it shows which signals the property is receiving.
Most certified CMPs integrate with GTM in a few clicks via the template gallery, so the technical part takes an hour, not a week.
How to track AI traffic: ChatGPT, Perplexity, and others
In 2025–2026, websites gained a fundamentally new source of visitors: assistants and AI search engines. People ask ChatGPT “which agency should I choose” or “how do I set up analytics” — and click the links in the answers. This traffic can no longer be ignored, and GA4 can show it.
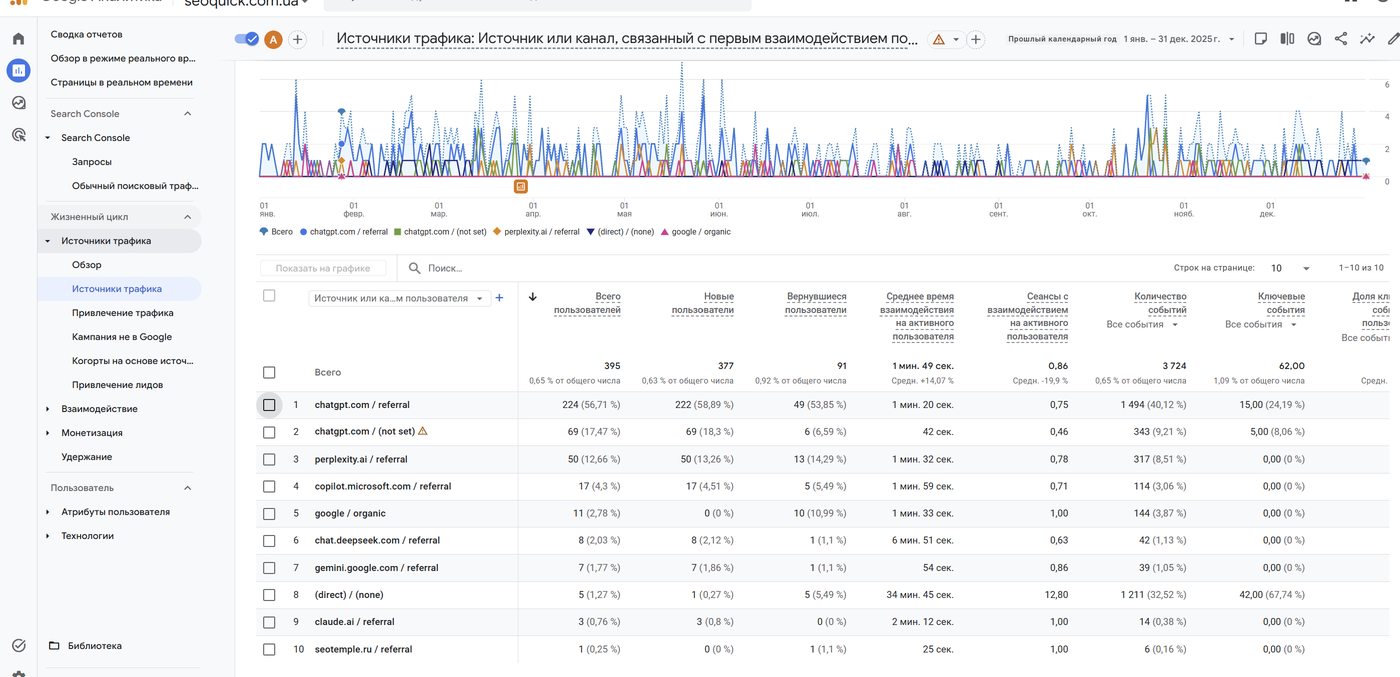
The basic approach is the “Traffic acquisition” report with the “Session source/medium” dimension. Look for these sources:
chatgpt.com / referral— visits from ChatGPT;perplexity.ai / referral— Perplexity;gemini.google.com / referral— Gemini;copilot.microsoft.com / referral— Microsoft Copilot;claude.ai / referral— Claude.
It’s more convenient to gather everything into a dedicated channel. In 2026 Google added a native “AI Assistant” channel to GA4 that automatically groups visits from ChatGPT, Gemini, and Claude — but Perplexity, for example, isn’t included yet and keeps landing in Referral. So it’s more reliable to create your own channel group:
- “Admin → Data display → Channel groups” → create a new group (the default one can’t be edited).
- Add an “AI Traffic” channel with the condition: source matches the regular expression
chatgpt\.com|perplexity\.ai|claude\.ai|gemini\.google\.com|copilot\.microsoft\.com. - Move this channel above the Referral channel in the list — GA4 applies rules top-down, and if Referral matches first, AI visits will never reach your channel.
Keep two limitations in mind. Custom channel groups only work from the moment of creation and don’t recalculate history — so set up the channel now, even if your AI traffic is still small. And some visits from AI apps arrive without a referrer and settle in Direct, so the real volume of this traffic is always somewhat higher than what you see.
SEOquick’s experience. AI traffic is no longer exotic — it’s a measurable channel with conversions. On the nadomu.kiev.ua project (at-home medical services in Kyiv, Ukraine), we grew traffic 10x over five years, and in 2025 GA4 recorded the first leads from ChatGPT referrals — the site started appearing in the assistant’s answers for commercial queries. How we got there — in our services website case study (in Russian).
In 18 years of work we’ve grown used to channels coming and going, but the rule never changes: start measuring a new traffic source before it becomes significant. With AI search, this is exactly that moment.
Common GA4 setup mistakes
This list comes from real audits — check your property against it:
- Double tag installation. GA4 is installed both via gtag.js and via GTM (or via a CMS plugin plus manually). The symptom: a suspiciously low engagement-based bounce rate and exactly 2x the pageviews. Verify with Tag Assistant.
- Data retention set to 2 months. The default value. Until you change it to 14 months, Explorations won’t show year-over-year trends. Historical data won’t come back retroactively — change it immediately.
- Internal traffic not excluded. The office, contractors, and you yourself are skewing the stats. Set up a rule in “Data streams → Configure tag settings → Define internal traffic” and activate the filter in “Data settings → Data filters” — by default it’s in testing mode and filters nothing.
- Unwanted referrals list not configured. Visits from payment gateways (LiqPay — a popular Ukrainian gateway, Stripe, PayPal) break the purchase session, and the order gets attributed to the payment processor instead of the real source. Add the gateway domains in “Configure tag settings → List unwanted referrals.”
- Key events not marked — or everything marked. In the first case you see no conversions at all; in the second, the reports lose meaning. There should be few key events, and each one should be about money or leads.
- UTM tagging is chaotic or missing. Untagged newsletters fall into Direct, social campaigns into generic Referral. Agree on a single
utm_source/utm_medium/utm_campaignconvention and apply it to every paid and owned channel. - The property’s time zone and currency don’t match the business. A small thing that turns reconciling GA4 with your CRM and ad accounts into pain.
- No Consent Mode with EU traffic. The consequences are described above: since July 2025 this is no longer a “recommendation” but a condition for advertising features to work.
- Test and production data in one property. Events from the dev domain pollute the stats. Either a separate property for development or a developer-traffic filter.
- Set up and forgotten. GA4 isn’t a one-time setup. Once a quarter, reconcile your events with the actual forms on the site: forms get renamed, landing pages get deleted, and events silently stop firing.
Checklist: GA4 is set up correctly if…
- The tag is installed one way only, on all pages, and Realtime shows your visit.
- Data retention is 14 months.
- Enhanced Measurement is on, internal traffic is excluded.
- 3–7 key events reflecting business goals are configured.
- For a store — e-commerce events with value and currency.
- Search Console and Google Ads are linked, conversions imported into ads.
- With EU traffic — Consent Mode v2 via a certified CMP.
- A channel group with AI sources is created.
- The unwanted referrals list is filled in (for e-commerce).
- The team has agreed on a UTM tagging convention.
FAQ
How much does Google Analytics 4 cost?
GA4 is free for the vast majority of websites, including large online stores. The paid version, Google Analytics 360, is only needed by enterprises with billions of events per month — it has higher limits, an SLA, and extended BigQuery export. If you’re asking this question, the free version is almost certainly enough for you.
How do key events differ from conversions?
They’re essentially the same thing: in March 2024 Google renamed GA4 conversions to key events to avoid confusion with Google Ads conversions. In GA4 you mark important events as key (up to 30 per property), and “conversions” now refers only to those imported into Google Ads for ad optimization.
How soon does data appear in GA4 reports?
In the Realtime report — within a few minutes of installing the tag. In standard reports, data takes up to 24–48 hours to process, so the most recent day is always incomplete. Draw conclusions and reconcile numbers using fully processed days, and use Realtime only to verify that tracking works.
Can I install GA4 without a developer?
Yes. On WordPress the Site Kit by Google plugin does it; Shopify, Wix, and Tilda have built-in fields for the Measurement ID. The universal path is Google Tag Manager: a developer installs the container once, and after that the marketer configures all tags and events through the web interface.
How do I see ChatGPT traffic in GA4?
Open “Reports → Acquisition → Traffic acquisition” and select the “Session source/medium” dimension — the visits show up as chatgpt.com / referral. To monitor all AI sources at once, create a custom channel group with a regular expression covering the domains chatgpt.com, perplexity.ai, gemini.google.com, and claude.ai, and place it above the Referral channel.

Link Building in Simple Words: Where to Get Permanent Links and How to Promote a Site with Links in 2026
Link building in simple words from a practitioner since 2008: how permanent links differ from rented links, why the black-hat SEO era is over, white-hat methods with examples, internal linking, AI-assisted link building, and sources.
Read →Google Ads Keywords in 2026: Research, Match Types, Negative Keywords
How Google Ads keywords actually work in 2026: real match type behavior, keyword research, campaign structure, negative keywords and PMax.
Read →Performance Max for an Online Store: A Setup and Optimization Case Study
How to set up Performance Max for an online store: a case study with ROAS growth from 2.8 to 5.1, the Merchant Center feed, asset groups, budget and optimization.
Read →Want to apply this to your site?
We will review the current situation, find the first growth levers, and suggest a practical working format.