A/B Testing: How to Boost Site Conversion by 1.5-2x (Step-by-Step Guide)
Any online resource requires constant monitoring and regular updates. A/B testing will come to the rescue here, telling you exactly what needs to be fixed.
A/B testing is a marketing tool that lets you determine the most conversion-friendly version of a website page through comparison.
A split test tracks which elements (buttons, headlines, images) and in what sequence "work" more effectively.
Want to get more leads and calls from your site?
Read on to learn how to boost conversion with an A/B test!
Let's figure out why it's so important to tailor a site to customers' needs using A/B testing.
The relevance of running split tests is growing every day.
This is primarily driven by high competition.
In some business niches, the cost of acquiring customers online sometimes reaches astronomical figures.
This is because people have the option of unlimited choice.
A person can open 20 similar sites, compare offers, and pick the best one.
And they want to do this with minimal effort.
That's why it's important to adapt your online resource to the needs of potential customers, to extract maximum value from incoming traffic — to get targeted leads and calls at the lowest possible cost.
Read on and stay in the loop!

Hey! Yes, you. Looking for traffic to your site? SEOquick will bring you 100% organic!
SEO is your long-term and reliable source of traffic from the Google and Bing search engines
We'll deliver comprehensive SEO promotion: content, reputation, on-page optimization, link building
Our SEO is white-hat, and our goal is to get you into the TOP! We know exactly what to do and how. That's exactly what you need, isn't it?
A/B Testing — What Is It in Simple Terms?
What is an A/B test?
Main goals and objectives.
Who is it for?
An A/B test is a marketing tool designed to measure the effectiveness of a website page through comparison.
The essence of the method is quite simple.
We create a duplicate of page A and change one metric on it — for example, the headline text, the call to action on a button, or an image.
Then we evenly distribute the incoming traffic: we show one version to half of the potential customers, and the other version to the remaining 50%.
As a result, we see which page more often helps achieve the set goal (a lead, a call, a subscription, a catalog download, etc.).
Important: The main goal of running an A/B test is to increase the conversion of a website page and reduce the cost of acquiring a potential customer. If we test 3 pages at once, the traffic should be distributed evenly (33.3% each).
Changing a seemingly insignificant element — say, the text on a CTA element (button) — can lead to higher conversion.
To test this hypothesis, it's enough to replace the call to action "Order" with "Get" during the split test and track the reaction of potential customers.
In addition, you can change the color, size of buttons, and other parameters.
Other elements on the page are tested using a similar principle.
Experiments are run with headlines, visual content, design elements, as well as forms, etc.
For example, a form with two fields often produces a more effective result than a form with 3-5 fields, due to its ease of perception.
Thus, with an A/B test we strive to adapt to the customer's needs and create the most user-friendly site interface possible.
Let's look at an example for clarity: if 1,000 people come to a site and 100 of them submit a lead, the conversion equals 10%.
Suppose that after replacing the "Order" button with "Get," conversion rose to 20%.
This means that out of 1,000 visits you'll now get 200 leads, even though your advertising investment stays the same.
Let's summarize the main objectives of split testing:
- tailoring the site to the specific needs of potential customers;
- extracting maximum value from incoming user traffic;
- increasing the conversion of the page under study;
- evaluating the effectiveness (impact on conversion) of any change on the site;
- reducing the cost of acquiring customers.
The main advantage of an A/B test is that it eliminates the need to make intuitive, unfounded decisions.
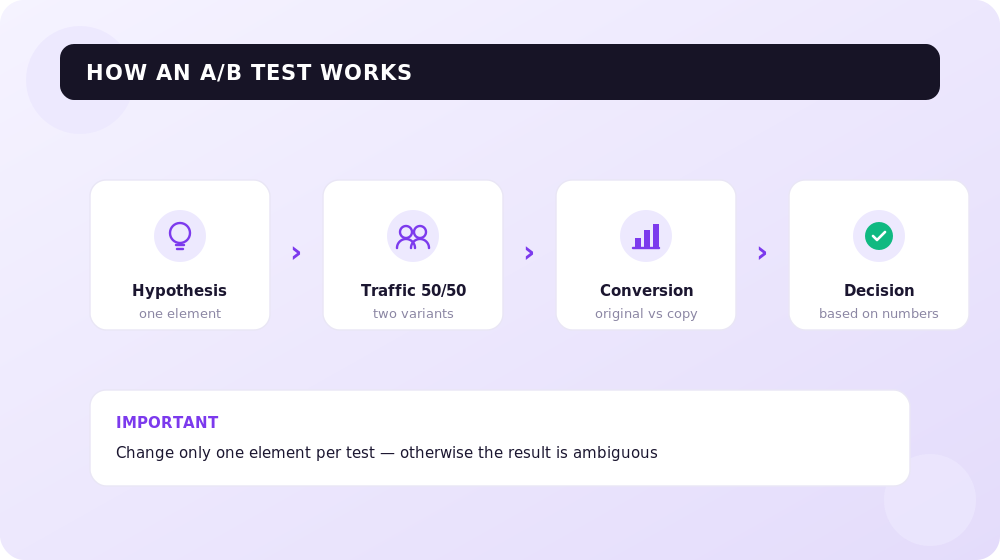
We form a hypothesis, launch the test, track the conversion (in the original and the duplicate), and then draw a conclusion based on numerical indicators.
Do you want to get free traffic?
Are you interested in promoting your site?
Fill out the form below and I'll personally get in touch with you, and we'll discuss a plan for growing your business!
Basic Principles of a Split Test
Why formulate a hypothesis correctly?
Testing conditions.
Statistical significance.
The foundation of any A/B test is a well-formulated and precisely fixed hypothesis.
Example of a hypothesis:
"If we change the CTA element text from 'Order' to 'Get,' then customers will click this button more often, and the page's conversion will increase by 10%."
Many entrepreneurs make the mistake of starting to implement competitors' testing strategies or advice from articles like "8 ideas for running an A/B test" on their own resource.
In each specific case, everything happens individually, so taking someone else's idea is not the most rational solution.
To correctly define a hypothesis for boosting conversion with a split test, we suggest you use a number of tools.
How to Form a Hypothesis?
Use Google Analytics to assess how users behave on the site: analyze scrolling, clicks, and the heatmap.
Analyze several sessions, see where visitors click most often, how they fill out the form, and what distracts them most.
For example, if you see that a large number of people leave at the form-filling stage, it means there are unnecessary fields in it, or you need to explain more clearly how to fill them out.
In addition, direct communication with customers is used to form hypotheses for improving site conversion.
Ask your current clients what problems arise when working with the site, what is difficult for them, and what, on the contrary, is easy.
To identify problem areas, you can also use services for usability analysis (What Users Do, User Testing, etc.).
You can form a working hypothesis using:
- tracking statistics in Google Analytics;
- direct communication with customers;
- usability analytics services.
Basic Testing Conditions
It's important that during a single split test only one variant of the hypothesis is checked.
This is the main rule. By changing one element on the page, we can precisely determine what affects the course of events.
In turn, replacing several parameters at once does not allow for an unambiguous conclusion.
For example, in the hypothesis "If we change the CTA element text from 'Order' to 'Get,' then visitors will ultimately click this button more often," we are studying the change of only one parameter — the text.
It is extremely important to choose target indicators: the number of clicks, registrations, or leads.
Perhaps it will be the average order value, the number of purchases, or the time a user spends on the site.
To correctly define this indicator, you need to return to the key problem that needs to be solved.
For example: To increase sales of one of three online courses, it was decided to make a duplicate of the online page and highlight the relevant block in a bright color. In this case, during the split test we account specifically for sales of that particular course, while cutting off other factors (time on site, total number of leads, etc.).
Important: Before launching the test, make sure the site has analytics configured that will record the target indicator.
The statistical significance of the split test also plays a significant role.
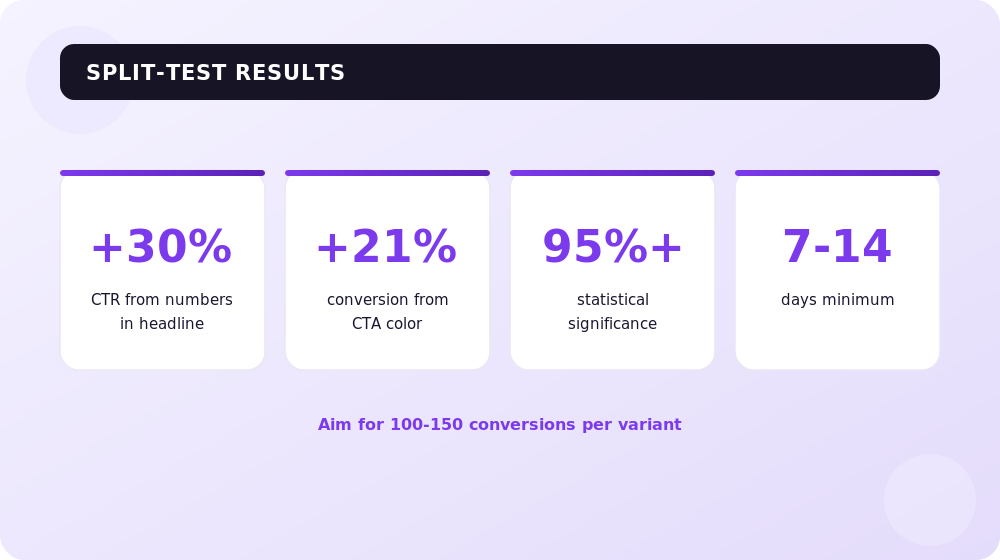
Aim for it to reach a value of 95% or higher.
This will signal that the experiment was a success and you can safely implement changes on the site.
However, foreign colleagues still recommend bringing this figure up to 99% (you can read more about this here).
In Google Analytics and other analytics systems, statistical significance is calculated automatically using special algorithms.
In addition, it can be calculated manually, but automatic calculation is still more preferable and reliable.
Important: The more people involved in the split test, the more reliable the result will be.
It's advisable to reach at least 100-150 conversions.
In the presented example — at least 100-150 button clicks for each variant (the duplicate and the original page).
Experimenting with lower figures will be difficult (for example, when it comes to an expensive product with a conversion of 1-2 clicks per week).
We also draw your attention to the duration of the A/B test.
It's rational for it to last at least 1 week.
This is because user behavior can change on different days of the week.
Let's say on Monday people more often browse products in an online store, but order them on Saturday.
The longer the experiment lasts, the better.
In Google Experiments, for example, the minimum A/B test time is set to 14 days by default.
So, once again we draw your attention to the basic rules for launching a split test:
- form only 1 hypothesis per test;
- strive to reach a minimum number of conversions of 100 or more for each tested page;
- make sure the experiment lasts 7 days or more.
After launching the A/B test, be sure to check that everything works.
If conversion rates differ significantly on the tested and original pages (for example, 0% and 15%), but you only replaced 1 indicator, check that everything is functioning properly — that all buttons and links work.
Recommended reading:
"Secret" Testing Rules
The concept of traffic homogeneity.
A simple way to check homogeneity.
Assessing the environment.
The influence of the environment on A/B test results.
We recommend you pay attention to a few more "secret" tricks that will let you increase the effectiveness of a split test on your site.
Many entrepreneurs make the mistake of bringing heterogeneous traffic to an online resource.
This negatively affects split test results.
For example, if customers from contextual advertising and social networks are driven to the original page, the same traffic should go to the duplicate.
If during the A/B test you start attracting customers from other sources — for example, from informational articles placed on third-party resources — the result may turn out to be inaccurate.
How to tell whether traffic is homogeneous:
- split the incoming traffic (50/50);
- run it to identical pages;
- compare the metrics — if conversion differs for pages with identical content, then you're attracting heterogeneous traffic, and running an A/B test is pointless.
In addition to traffic homogeneity, you should also account for the surrounding environment that affects research results.
For example, at the height of the summer holidays and at the end of December, test results may differ.
A sharp jump in the dollar exchange rate and other external factors we cannot influence may also distort the result.
What to Test — TOP 8 Elements
What to pay attention to?
The most popular elements.
Examples of successful tests.
Once again we draw your attention to the fact that a split test is an applied tool that lets you influence various site metrics.
The final choice of page elements to study depends on a hypothesis based on the set objectives.
Let's say if a page has a bounce rate of 70%, and most potential customers leave it within the first 3-4 seconds, it makes sense to test the headline, the call to action, or the image on the main screen.
In addition, you can experiment with the color scheme, font readability, and other parameters.
We also recommend studying how the time users spend on a site affects search rankings here.
In turn, if studying the metrics reveals that most customers leave the page not right after "landing," but in the process of filling out the lead form, it's rational to work on this element.
A split test will help you choose the optimal text variant, button color, and the most effective number of fields in the lead form.
Important: When testing, rely exclusively on your own hypothesis aimed at solving an individual problem. The results of a completed A/B test cannot be replicated. They will differ in each specific case. Don't try to reproduce them — it's pointless.
What Is Tested Most Often?
Headlines
On websites and landing pages, headlines are tested often.
They affect the visitor, prompting them to study the information, immerse themselves in the topic, and perform the target action.
The more precisely the headline text is chosen, the better it reflects wishes and addresses the customer's needs, and accordingly, the greater its impact on them.
That's why different headline variants are often used when running an A/B test.
Interestingly, using numbers in an offer increases click-through rate by an average of 30% (proven experimentally here).
CTA Elements
CTA elements play an important role in moving the customer through each stage of the sales funnel.
Let's say a customer clicks the "Order" or "Get" button on a test page, then lands on a page with the product description, where they click the "Make Payment" button, and so on.
During a split test, you can study not only the call to action on the CTA element, but also its placement, size, as well as add arrows to draw attention.
Let's look at how changing the color of a CTA element can improve the conversion rate by 21%.
The initial text variant "Get Started Now" was presented in green, so it blended in with other elements in that color scheme (the logo, list items, and some image elements).
During the test, a duplicate page was created with a red button that contrasted sharply against the overall background.
This made it possible to increase the conversion rate.
Text Content
Let's look at a small example of how adding a few test fields to a lead form can improve subscription conversion by 83.75%.
The experiment was carried out on the ContentVerve portal.
On the left is the original page, and on the right is the duplicate (the test variant).
In the latter, information was added explaining to the user what they would receive after providing their contact details.
To capture visitors' attention, you need copy that sells.
Image Testing
In 3rd place by experiment frequency is visual content.
Graphic elements help create visual images and improve the perception of textual data.
That's why it's extremely important to pay attention to the proper selection of images, video, and audio files.
An experiment was conducted on the Highrise website.
During the A/B test, a photo of a girl smiling warmly was added to the site's homepage.
As a rule, users subconsciously mirror emotions, which most likely contributed to a 102% increase in click-through rate.
Lead Form Testing
Surprisingly, removing just one field from a lead form can help increase annual revenue by $12 million.
This is evidenced by a split test conducted by Expedia.
During the study, marketers removed the "Company Name" field, which had a positive effect on the result.
Important: We draw your attention to the fact that in most cases short lead forms work better than long ones. If you want to add extra fields, simply don't make them required. The logic here is simple — a large number of fields simply puts users off (it's associated with difficulties when filling them out).
Quite often social media buttons, navigation elements, and pricing pages are tested.
In some cases, a radical redesign is undertaken.
This is rational if the site hasn't been updated in a long time.
It's advisable to prepare for a global redesign in advance.
In this case, the company "Silver" first ran several additional tests that determined that a light image of a girl works better than a dark photo of a man.
In addition, it was found that a block describing the service's capabilities, placed below the main photo, helps increase user engagement.
Also during the split test, the new image was moved down along with four benefit blocks, which also had a positive effect on the number of registrations (conversion increased by 57%).
So, what can be tested?
- headlines and text content (product descriptions, subheadings, and specifications);
- CTA elements (buttons) — their color, size, calls to action;
- the lead form (number of fields, placement);
- social media buttons;
- navigation elements (the menu);
- pricing pages;
- visual content (photos, videos);
- a radical page redesign (with experiments conducted beforehand).
What to Use to Run a Split Test — A Review of Services
Paid services for A/B testing.
How to run a test for free?
An experiment in Google Analytics — a step-by-step guide.
Now you know what A/B testing is and how to choose a hypothesis for it.
It's time to run the experiment.
And you can do this in two ways — paid and free.
Each of them has its advantages and disadvantages.
Paid Services
The main advantage of paid services is that they let you run split tests with minimal effort using a visual editor.
That is, you won't have to manually copy code and deal with HTML/CSS — it's enough to simply make a copy, move blocks, or change their styling within 3-5 minutes.
In addition, broad functionality is available, including accounting for audience targeting metrics.
For example, if a site operates in Belarus and Ukraine, but you want to test the behavior of only the Ukrainian audience, you select Ukraine in the split test settings.
In this case, residents of the other country will see the original page, while residents of Ukraine will see the duplicate with the changed data.
Technical support and help in setting up the experiment are also available.
Advantages of paid services:
- a convenient visual builder;
- fast editing of blocks without HTML/CSS knowledge;
- advanced audience targeting settings;
- technical support during analysis.
The disadvantages of these services include an English-language interface, which somewhat complicates interaction.
In addition, you'll have to pay to use them; the cost ranges from $20 to $50 per month.
A list of paid services for running A/B tests:
- Changeagain.me (supports Russian);
- Optimizely.com;
- VWO.com.
How to Run a Split Test for Free?
If you're interested in how to run a split test for free, we recommend paying attention to the Google Analytics service, specifically its "Behavior — Experiments" functionality.
The service is quite functional, but it has its peculiarities.
First, there's no visual editor here, so you'll have to do everything manually — installing the code for all test variants each time.
In addition, you'll need a basic understanding of HTML/CSS principles, otherwise difficulties may arise.
The downsides of the free method also include the lack of technical support and audience targeting configuration options.
However, if you wish, you can — and even should — figure out Google Analytics if you want to increase site conversion using A/B testing.
Speaking of free split testing methods, it's also worth mentioning custom scripts offered by programmers.
Setting up and launching such a test correctly will take quite a lot of time.
In addition, in this case there's no guarantee of the result's reliability.
That's why we recommend using the traditional method — experiments in Google Analytics.
An experiment in Google Analytics — a step-by-step guide
Step 1
We choose the goal of the experiment, specify the indicator we want to track, as well as the % of traffic the experiment will be run on.
Step 2
We define the original page variant, as well as its possible variants (up to 10) with their URLs specified.
Step 3
We add the manually generated experiment code to the original page.
Step 4
We carefully check everything once more and launch the experiment.
After some time, you can move on to analytics.
To do this, simply select the created experiment and review the detailed report containing in-depth information about the pages under study.
In the report you'll be able to review:
- the number of visitors;
- the number of conversions;
- the conversion rate (the ratio of the number of conversions to the number of visits).
In addition, the functionality lets you compare the difference in the conversion rate of the original page versus the tested one.
The system will also provide a probable estimate of which test variant may outperform the original.
You can learn more about how to work with the Analytics experiments interface in the official Google reference.
Conclusions
Running A/B tests is essential in today's competitive environment.
This tool lets you determine the most effective version of a page in terms of conversion and squeeze the maximum out of incoming traffic.
While competitors pay sky-high prices for customer acquisition, you'll be able to improve your site's metrics to get calls, leads, and registrations at the lowest possible cost.
Anyone can handle running an A/B test.
You have at your disposal both paid and free tools with advanced functionality that let you track your site's key performance indicators.
And which split testing methods do you use?
Share your opinion in the comments!

Link Building in Simple Words: Where to Get Permanent Links and How to Promote a Site with Links in 2026
Link building in simple words from a practitioner since 2008: how permanent links differ from rented links, why the black-hat SEO era is over, white-hat methods with examples, internal linking, AI-assisted link building, and sources.
Read →Google Ads Keywords in 2026: Research, Match Types, Negative Keywords
How Google Ads keywords actually work in 2026: real match type behavior, keyword research, campaign structure, negative keywords and PMax.
Read →Performance Max for an Online Store: A Setup and Optimization Case Study
How to set up Performance Max for an online store: a case study with ROAS growth from 2.8 to 5.1, the Merchant Center feed, asset groups, budget and optimization.
Read →Want to apply this to your site?
We will review the current situation, find the first growth levers, and suggest a practical working format.